The final meeting between the New York Rangers and the New York Islanders at Nassau Coliseum provided a great backdrop to continue to highlight shot quality and how it impacts the game of hockey. One of the illustrative tools that I have used in my ongoing Shot Quality Project are heat maps to visualize success rates on the ice for goaltenders and shooters.
Heat maps provide visual indications of danger areas on the ice. When tracking the Rangers-Islanders game on March 10, I noticed an interesting correlation between the danger zones that Steve Valiquette regularly highlights and goaltender trouble zones.
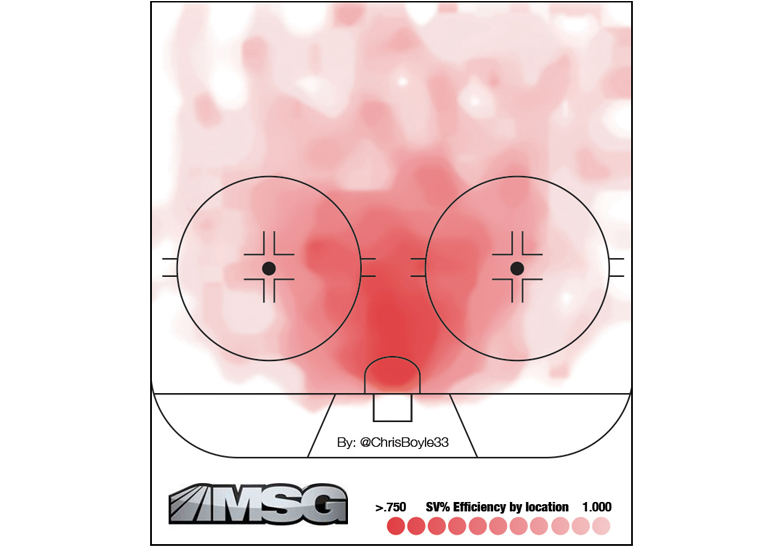
If we take a look at the scoring zones on the ice, we can see where shot quality comes into play. When we factor in the types of plays that lead to high quality opportunity green shots, we see a deep red color that lines up almost perfectly with the royal road.
Plays that cross the royal road force goaltenders to move laterally, leading to holes opening up that do not exist unless you attack them in straight lines. When factoring in rebound shots, tips and pre-shot movement related to passes, we cover the area that leads to the most goal scoring success.
Most shots that provide success outside the direct slot are the result of screen plays, which is when the offense layers bodies in front of the goaltender to block his vision.
Red shots exist on the exterior of most of these plays. We can see this highlighted by the white or light pink areas where a goaltender’s save percentage is above the .950 mark. In this area, red shots result in a 97% success rate for goaltenders.
If we look at where the red shots came from in the Rangers-Islanders game on March 10, we see a pattern of shots that live almost exclusively in the low percentage success area.
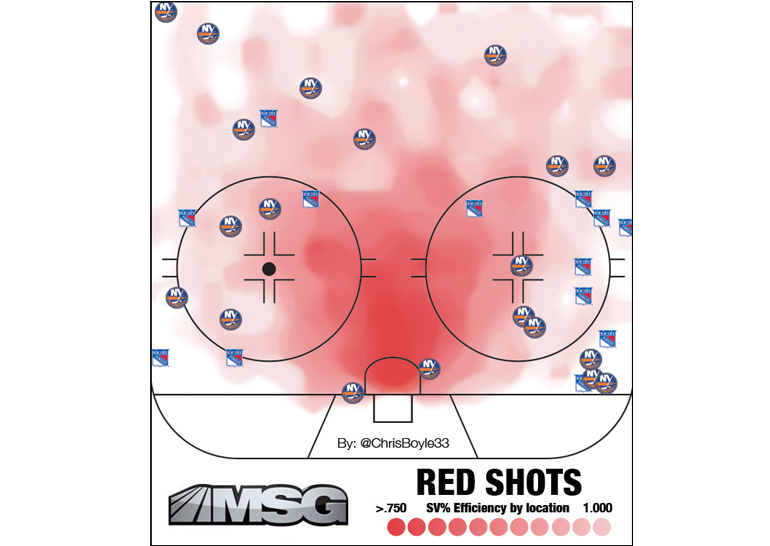
Once again, these shots have an extremely low success rate because of the circumstances in which they originated. No pre-shot movement, no screen, no deflection.
Every one of these shots allowed Jaroslav Halak and Cam Talbot to line them up by telescoping out and maintaining a clear sight, while maintaining their depth and angle. Only one of these red shots resulted in a goal and that was mere luck, as a wraparound attempt deflected off Talbot’s blocker and then leg, and in for a red goal.
If this environment can be provided for the goaltender on a regular basis, even an average goaltender can begin to appear like Henrik Lundqvist.
As a goaltender, you’re looking for these types of red shots. The more you face, the more you feel the puck, which warms up goaltenders for more difficult situations.
On the other hand, we can see why green shots are so successful and why goaltenders struggle when faced with these high-end opportunities.
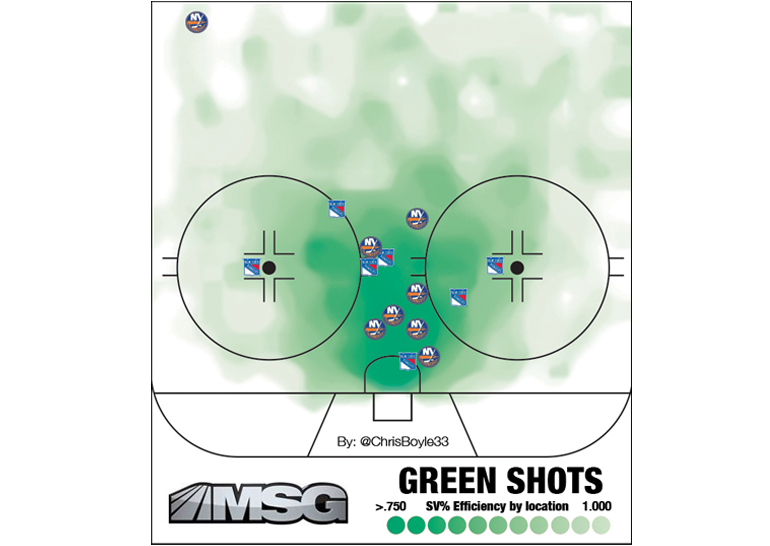
Outside of one screen shot (the outlier in the above graphic); all of the high-end opportunities exist within the low success rate areas for a goaltender. Broken plays, crossing the royal road with a pass or possession, as well as deflections and screenplays, can make a goaltenders life miserable.
Combined, Halak and Talbot only faced about 30% (15-of-47) of these high-end opportunities. This was a key reason as to why the contest was low scoring. Contrast that to the 31 shots they faced in Rangers-Islanders previous meeting and it is easier to understand why that game resulted in a 6-5 pond hockey affair.
Interesting to note, not one shot resulted in a rebound opportunity. This was likely due to the high percentage of shots that originated from red areas.
When a goaltender receives these shots, it allows for easier containment and control. This results in more pucks being smothered, absorbed or easily placed into non-dangerous scoring zones for their defensemen to begin transition offense.
It is easy to see why some nights are easier than others for goaltenders evidenced by the stark contrast provided by the last two Rangers-Islanders games.
When we break down the game into finer details, we begin to understand how shot quality can impact a game, as well as goaltenders’ percentages.